
Definition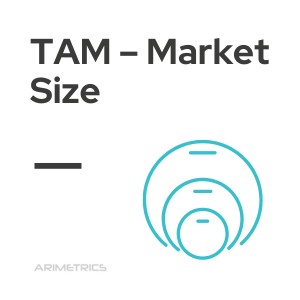
TAM, or Total Addressable Market, is an estimate of the maximum economic value a product or service could generate if it captured one hundred per cent of the defined market. It represents a theoretical opportunity under stated boundaries, a time period, and specific assumptions; it is not the revenue a business will necessarily achieve.
The result is normally expressed as annual revenue, although it may also be measured in customers, units, or transactions. For the metric to be meaningful, the unit of measure, geography, segment, period, price, and data sources must be stated.
What TAM represents
TAM defines the economic universe a solution could address if there were no capacity, distribution, or competitive constraints. It provides a reference ceiling for analysing an opportunity, but it does not prove effective demand or mean that every possible buyer has the same need.
The market definition determines the result. A calculation for “business software” would be too broad for a tool intended only for private clinics in Spain. Precise market segmentation should establish the problem solved, who can buy, where, how often, and within which competitive category.
TAM, SAM, and SOM
The three concepts describe different levels of the same opportunity. TAM covers the entire theoretically addressable market; SAM restricts that universe to the portion the offering can serve; and SOM estimates the share the business could reasonably capture within a defined horizon.
- TAM: Total possible demand within the adopted market definition.
- SAM: Market available to the offering based on product, territory, regulation, channel, or operational capacity.
- SOM: Attainable share of SAM considering competition, resources, distribution, and acquisition pace.
TAM is not the same as a target. A target describes the audience selected for a commercial or communication activity, while TAM, SAM, and SOM quantify a market opportunity at different levels of reach.
How to calculate TAM
There is no single formula for every business. The method should reflect the revenue model and must not mix users, buyers, units, and turnover. When a business charges per customer, a basic formula is: annual TAM = potential customers × average annual revenue per customer.
Top-down method
A top-down approach starts with aggregate figures from public bodies, trade associations, or industry studies and applies filters to reach the relevant market. It is quick and useful for checking scale, but it may inherit broad categories, outdated data, or assumptions that do not fit the offering.
Bottom-up method
A bottom-up approach begins with observable data: accounts that meet the criteria, units consumed, purchase frequency, and price. It is often more defensible because it connects with the commercial model, although it still depends on the quality of the population data, sample, and adoption assumptions.
Value-based method
Economic value may be estimated from the saving or benefit the solution creates for the customer and the share the provider could capture through pricing. This method can help with new categories that lack historical data, but both the problem and willingness to pay must be validated.
Calculation example
Suppose software is aimed at 20,000 clinics that meet the defined market criteria and has an average subscription of €1,200 per year. The initial calculation is 20,000 × €1,200, producing an annual TAM of €24 million.
This result is not a sales forecast. If the business operates only in territories containing 8,000 clinics, its SAM would start at €9.6 million. If capacity and competition make 3% of that SAM attainable during the period, the estimated SOM would be €288,000. Each figure should retain its assumptions so it can be reviewed.
What TAM is used for
A well-built TAM helps compare opportunities, prioritise segments, size a market-entry strategy, and explain the context of a buyer persona. It can also test whether a growth ambition is compatible with the defined market and identify where the analysis needs stronger evidence.
In a business plan or investor discussion, TAM provides potential scale, but it should appear alongside SAM, SOM, competition, acquisition, retention, margins, and capital requirements. A large market does not guarantee a strong ROI or compensate for a weak product-market fit.
Errors and limitations
A common error is to start with a global industry and apply an arbitrary percentage. This produces an impressive figure but does not show that the product can serve those buyers. The market is also overstated when the whole population is counted, users are confused with customers, or the calculation uses a price demand will not accept.
Before using the result, review these minimum criteria:
- Scope: Product, customer, geography, channel, and period are defined.
- Sources: Data is traceable, comparable, and sufficiently recent.
- Units: Customers, purchases, prices, and revenue use the same time basis.
- Duplication: A buyer or revenue item is not counted in several segments.
- Sensitivity: The calculation shows how price, volume, or adoption changes the result.
TAM is a dynamic estimate. It changes with prices, regulation, technology, behaviour, competitors, and the category definition. It should be updated when its data or assumptions change and presented as a range when uncertainty is material.