
 Definition:
Gephi is an open-source desktop application for exploring, analyzing and visualizing graphs or networks. It represents entities as nodes and their relationships as edges, allowing structures made up of people, pages, documents, organizations, proteins or other connected elements to be studied.
The application combines an interactive graph view with data tables, filters, layout algorithms and network analysis metrics. A visualization is not a conclusion by itself: it helps reveal patterns and formulate questions that must be checked against the data, method and context of the network.
Índice de contenidos
History and versions of Gephi
Gephi began in 2008 as a project developed by students at the University of Technology of Compiègne in France. Its 2009 academic paper described open software for exploring and manipulating networks. The project continues under a community that maintains its code, documentation and extension ecosystem.
The main version, Gephi Desktop, runs on Windows, macOS and Linux. It is developed in Java and uses OpenGL to provide interactive graph exploration. Projects can be saved to retain data, appearance and part of the analysis configuration.
The project also provides Gephi Lite, a version for modern browsers that requires no installation. It shares exploration, appearance and layout operations, but it should not be assumed to reproduce every feature, format or extension available in the desktop application.
How Gephi works
The process starts with a set of nodes and edges. Each element can include attributes such as a category, date, weight or label. The quality of the result depends on whether those relationships and attributes accurately represent the phenomenon being studied.
A common analysis workflow includes the following stages:
- Import the data: Gephi supports graph formats, CSV spreadsheets and connections to certain databases. Identifiers, edge types, duplicates and missing values should be checked before analysis.
- Explore and filter: The Data Laboratory supports column review and attribute editing, while filters isolate subsets according to properties or structure.
- Calculate metrics: Statistical modules compute measures for nodes and networks, and their results can be added as new columns.
- Lay out and represent: Layout algorithms position nodes, while appearance controls assign sizes, colors and labels according to selected attributes.
- Export: The visualization can be prepared for output in formats such as PNG, SVG or PDF and retained within the Gephi project.
The order is not necessarily linear. Analysis commonly alternates between filters, metrics, layouts and data checks until the representation is readable and consistent with the initial question.
Metrics and layout algorithms
Gephi includes common network analysis measures such as degree, betweenness centrality, closeness, clustering coefficient, modularity, shortest paths and PageRank. Each metric answers a different question; a high value does not generally mean that a node is the most important.
Layout algorithms such as ForceAtlas2, Fruchterman-Reingold and OpenOrd calculate positions to improve readability. The visual distance between two nodes depends on the algorithm and its parameters, so it does not necessarily represent geographic distance, causality or actual affinity.
Size, color and labels can be tied to metrics or attributes. These choices support interpretation, but they can also exaggerate differences. A reproducible visualization should retain the source data, applied filters, selected metric and relevant configuration.
Applications of Gephi
Gephi is used when the subject of study can be expressed through relationships. Its applications are not limited to social networks:
- Academic research: Studying social, biological, bibliographic, linguistic or collaboration networks.
- Data journalism: Exploring relationships among people, companies, documents, contracts or events.
- Web analysis: Representing internal or external links to observe clusters, depth levels and highly connected nodes.
- Organizations and markets: Exploratory analysis of relationships among teams, suppliers, customers or information flows, without attributing causality solely to the graph.
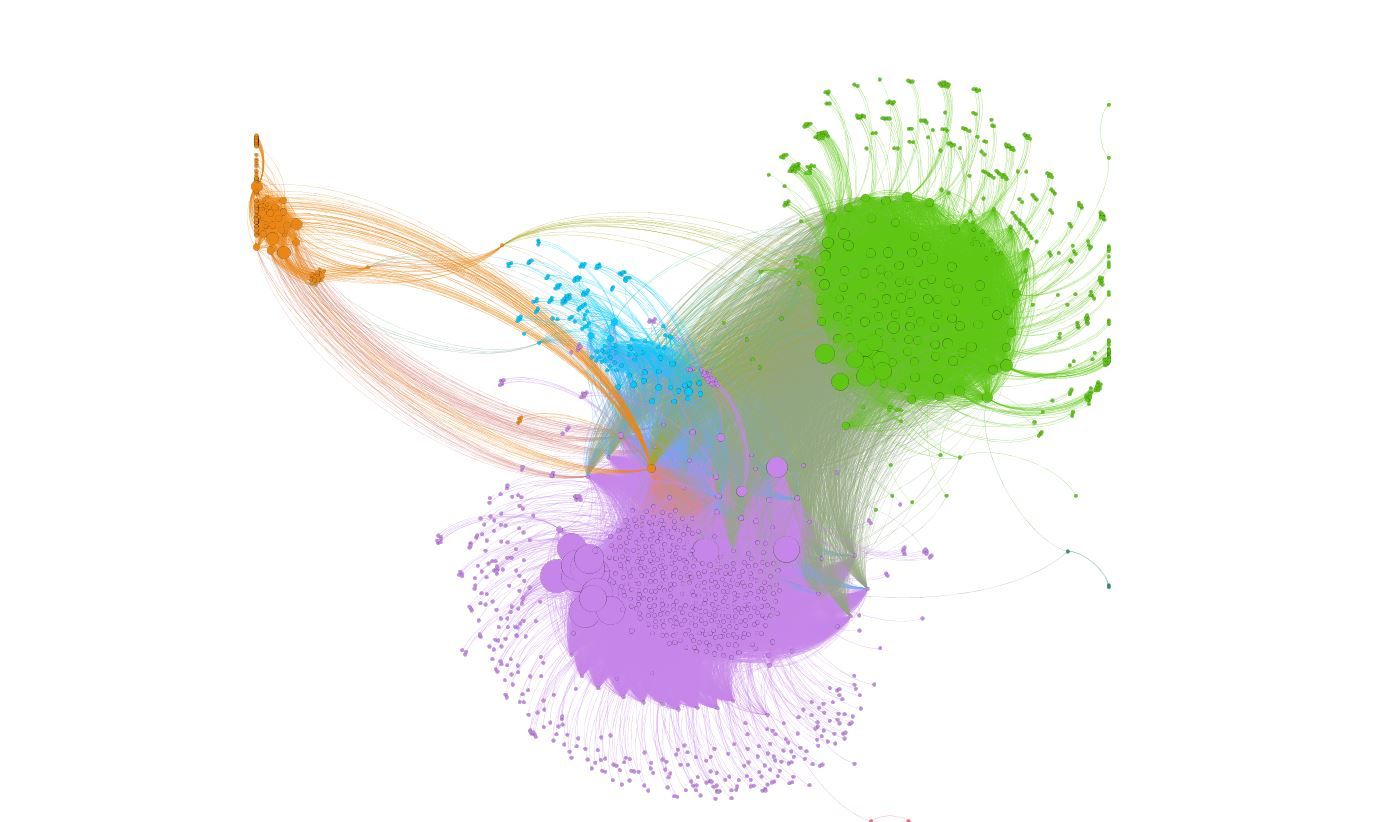 The image shows an example of an internal link network for a website. Colors separate thematic categories and node size represents a calculated value. Interpreting the graph requires knowing which data was included and how those visual variables were assigned.
Extensions and automation
The modular architecture supports add-ons installed from the plugin portal. These extensions can add layouts, metrics, filters, connectors or import and export formats. The availability and compatibility of each plugin depend on its maintenance and on the Gephi version being used.
Developers can create modules through the project’s APIs. Gephi Toolkit packages analysis components as a Java library for running processes without the desktop interface, although integration requires development and does not amount to automatic execution of every manually created project.
Limitations of Gephi
Performance depends on the number of nodes and edges, their attributes, the selected algorithm and the computer’s resources. Large or dense networks can be difficult to calculate and represent, even when the file can be imported successfully.
Gephi supports visual exploration, but it does not correct sampling errors, incomplete relationships or collection bias. Nor does it turn a structural coincidence into a causal explanation. Documenting the source of the data and validating interpretations are as important as configuring the visualization.